Main Content
Structure, function, and evolution of genome-wide regulatory networks
Most projects that we pursue concern the functioning and evolution of genome-wide regulatory systems in organisms ranging from bacteria to humans. The type of large-scale questions that we aim to address include understanding how regulatory systems are integrated on a genome-wide scale, how regulatory networks are structured, how these systems control and potentially exploit the inherent noise in gene regulatory processes, how stable cell types are defined and maintained, how gene regulation evolves, and understanding under what conditions regulatory complexity can be expected to increase in evolution. Another major topic of interest in our group is the discovery and analysis of quantitative laws of genome evolution. We are particularly interested in using high-throughput genomic data to put theories of genome evolution on a strictly empirical footing.
Our group pursues both theoretical/computational and experimental approaches and our projects can be roughly divided into'dry lab' projects in which we develop regulatory genomics tools for studying gene regulatory networks in higher eukaryotes, and 'wet lab' projects in which we study gene regulation at the single-cell level in E. coli.
Regulatory genomics tools: from binding site constellations to genome-wide regulatory programs
In spite of the large volumes of data gathered by high-throughput measurements technologies in recent years, our knowledge and understanding of the genome-wide regulatory networks that control gene expression remains extremely fragmentary. We are still very far from being able to do meaningful quantitative modeling of these gene regulatory networks. Consequently, and understandably, the focus in most of the regulatory genomics community has remained firmly on data gathering efforts. In our opinion, this continuing primacy of experimental data gathering has led to a fairly careless attitude toward data analysis methods in many studies. We feel that the lack of rigorous and robust methodologies for interpreting high-throughput data is currently a major stumbling block in regulatory genomics research, and our group aims to help remedy this situation by developing analysis tools that use methods of the highest rigour, that can be automatically applied to raw data-sets, and that provide robust predictions with concrete biological interpretations. We typically strive to make our tools available through automated interactive web-services, thereby empowering experimental researchers to perform cutting-edge analysis methods on their own data.
For over a decade we have been developing Bayesian probabilistic methods that combine information from high-throughput experiments (e.g. RNA-seq, ChIP-seq) with comparative genomic sequence analysis. Very roughly speaking, our projects concern identifying regulatory sites genome-wide in DNA and RNA, understanding how constellations of regulatory sites determine binding patterns of transcription factors and, ultimately, gene expression and chromatin state patterns. Finally, we aim to develop quantitative and predictive models that describe how dynamic interactions between transcriptional and post-transcriptional regulators implement gene regulatory programs that define cellular states and the transitions between them.
With regards to the predictions of regulatory sites in DNA and RNA, we have been working on extending the well-known position-specific weight matrix models of transcription factor (TF) binding specificity into dinucleotide weight tensor models that take arbitrary dependencies between pairs of positions into account. We have also been developing a completely automated procedure, called CRUNCH for analysis of ChIP-seq data, including comprehensive downstream motif analysis of binding regions. Using CRUNCH we have analyzed large-collections of ChIP-seq datasets in humans, mouse, and Fly, and have been using these to curate comprehensive sets of regulatory motifs in these model organisms. All our genome-wide regulatory site predictions are available in various formats through our SwissRegulon database and genome browser.
To take a first step toward modeling how constellations of regulatory sites determine genome-wide expression patterns we developed an approach, called Motif Activity Response Analysis (MARA), that models the expression of each gene as a linear function of the binding sites that occur in its promoter, and unknown 'motif activities' that represent the condition-dependent activities of the regulators binding to these sites. Since the original presentation of this approach, in the FANTOM4 collaboration with the RIKEN Institute in Yokohama, Japan, we have been working both on completely automating the MARA approach and on extending it in a number of ways, including using MARA to model chromatin dynamics in terms of local constellations of regulatory sites. MARA is now available through a fully automated webserver, called ISMARA (integrated system for motif activity response analysis), available at ismara.unibas.ch , where users can perform automated motif activity analysis of their micro-array, RNA-seq, or ChIP-seq data, simply by uploading raw data (Fig. 1). The system has already been successfully used to predict key regulatory interactions in substantial number of studies, and we are working on various further improvements and extensions of the system. This includes extension to additional model organisms such as Drosophila and E. coli, significantly extending the set of regulatory motifs that it uses, and incorporation of distal cis-regulatory modules. In addition, several of ISMARA's recent applications involve systems that are highly medically relevant and we plan to adapt ISMARA in ways that aim to increase its medical relevance. In particular, we want to extend ISMARA to allow it to infer the effects of single nucleotide polymorphisms on gene expression and regulatory programs genome-wide. Finally, we are currently working to adapting ISMARA to be able to analyze data from single-cell RNA-seq experiments.
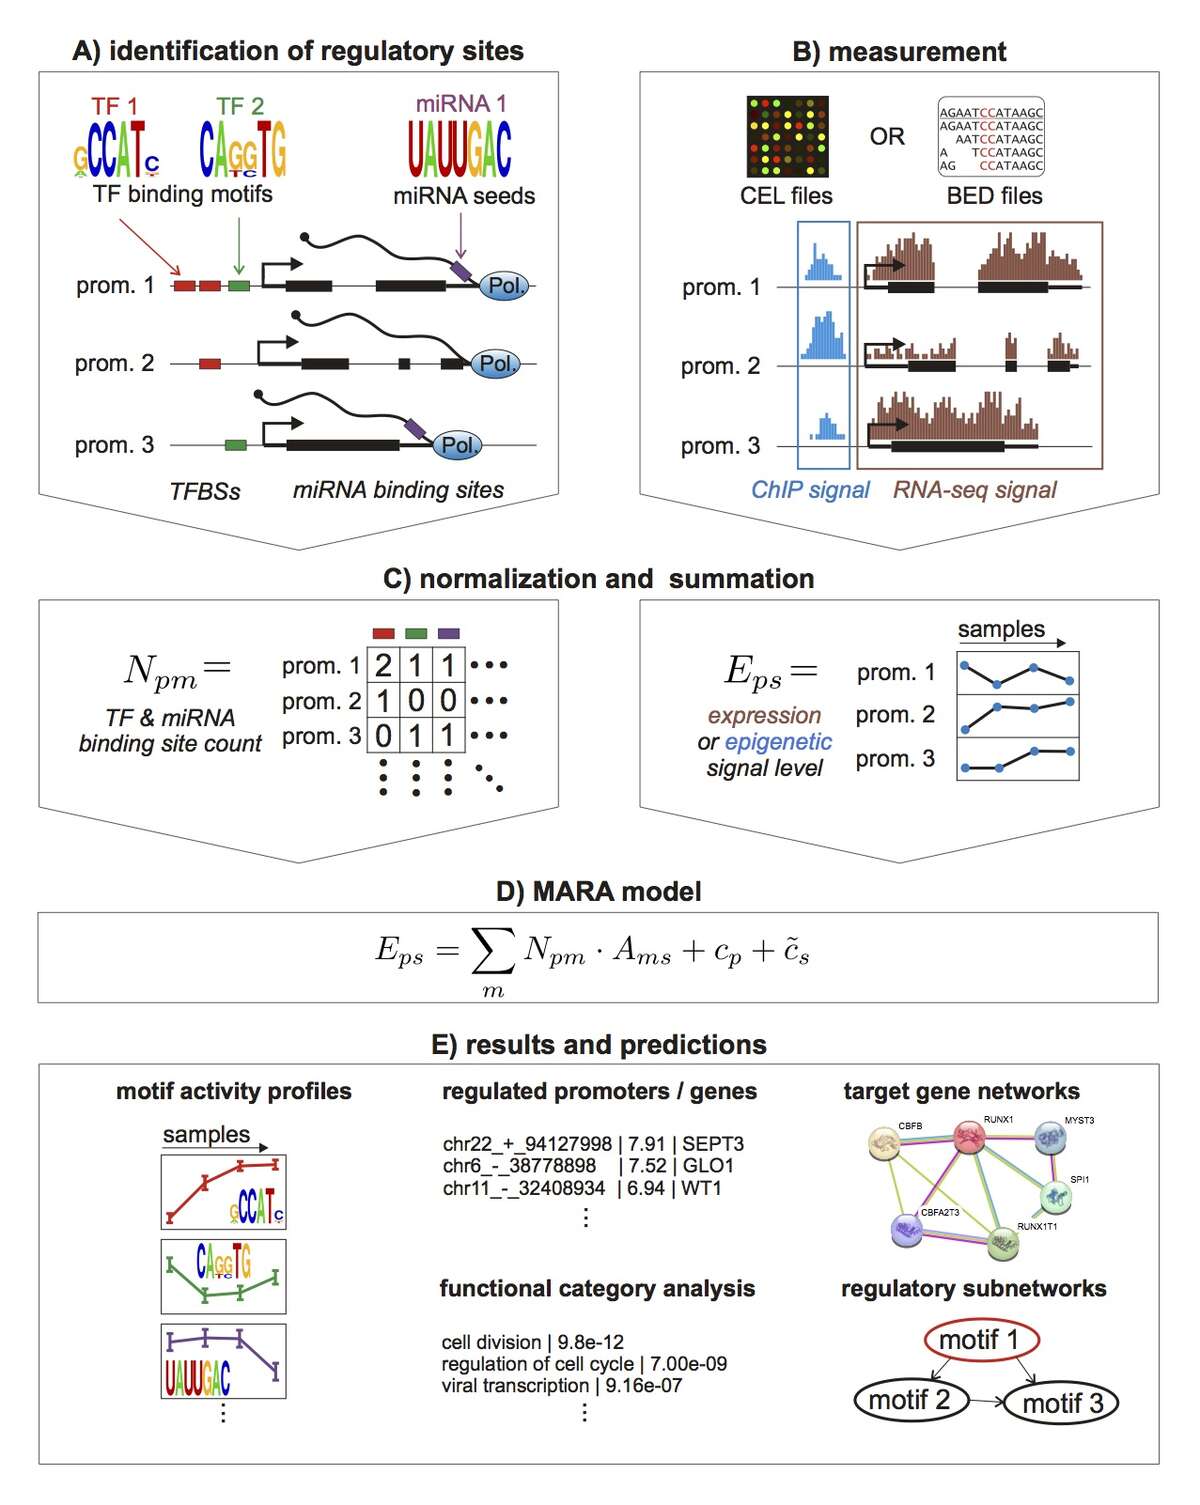
Fig. 1: Outline of the Integrated System for Motif Activity Response Analysis. A: ISMARA starts from a curated genome-wide collection of promoters and their associated transcripts. Transcription factor binding sites (TFBSs) are predicted in proximal promoters and miRNA target sites are annotated in the 3’ UTRs of transcripts associated with each promoter. B: Users provide measurements of gene expression (micro-array, RNA-seq) or chromatin state (ChIP-seq). The raw data are processed automatically and a signal is calculated for each promoter and each sample. C: The site predictions and measured signals are summarized in two large matrices. The matrix N contains the total number of sites for each motif m in each promoter p and the matrix E contains the signal associated with each promoter p in each sample s. D: The linear MARA model is used to explain the signal levels in terms of regulatory sites and unknown motif activities, which are inferred by the model. E: As output, ISMARA provides the inferred motif activity profiles of all motifs across the samples sorted by the significance of the motifs. A sorted list of all predicted target promoters is provided for each motif, together with the network of known interactions between these targets and a list of Gene Ontology categories that are enriched among the predicted targets. Finally, for each motif, a local network of predicted direct regulatory interactions with other motifs is provided.
Gene regulatory dynamics at the single-cell level in bacteria
Since 2010 our group also includes a wet lab component where we study gene regulation at the single-cell level in E. coli. We are particularly interested in stochastic aspects of gene regulation at the single-cell level, how fluctuations in the physiological state of the cell couple to gene expression fluctuations, how stochastic fluctuations propagate through the regulatory network, and the role of stochasticity in the evolution of gene regulation.
In the first major wet lab project of our lab, we set out to study how natural selection has shaped the noise characteristics of E. coli promoters. In particular, using FACS selection in combination with error-prone PCR, and starting from a large collection of random sequences, we evolved a collection of synthetic promoter sequences in the lab. Surprisingly, we found that these synthetic promoters generally exhibit noise levels that are lower than those of most native E. coli promoters. In particular, native promoters that are known to be regulated by one or more TFs tend to exhibit elevated noise levels. Since our synthetic promoters were selected solely on their mean expression and not on their noise properties, this allowed us to conclude that native promoters of regulated genes must have experienced selection pressures that caused their noise levels to increase.
To explain these observations we developed a new theory for the evolution of gene regulation that calculates the ‘fitness’ of a promoter as a function of its coupling to transcriptional regulators and the noise levels of these regulators (Fig. 2). This analysis shows that noise propagation from regulators to their target genes can often be functional, acting as a rudimentary form of regulation. In particular, whenever regulation has limited accuracy in implementing a promoter's desired expression levels, selection favors noisy gene regulation. The theory provides a novel framework for understanding when and how gene regulation will evolve, and shows that expression noise generally facilitates the evolution of gene regulatory interactions.
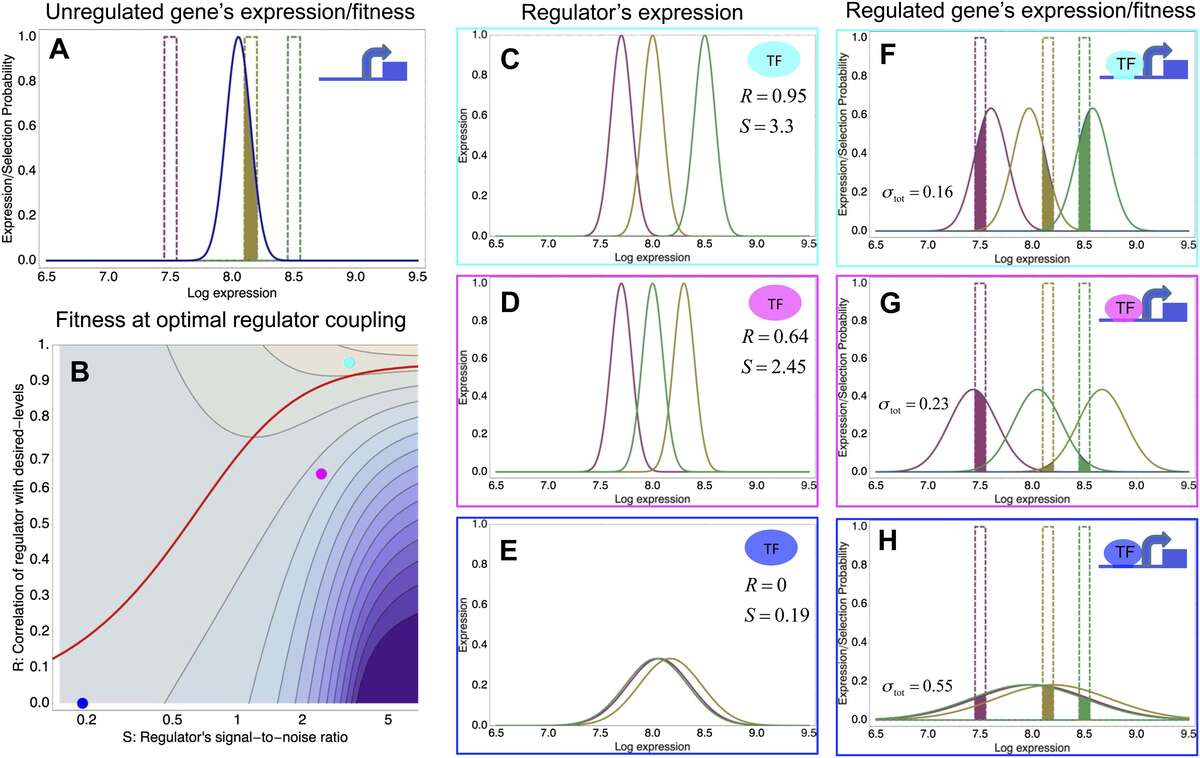
Fig. 2: A model of the evolution of gene expression regulation in a variable environment. (A) Expression distribution of an unregulated promoter (blue curve) and selected expression ranges in three different environments, that is, the red, gold, and green dashed curves show fitness as a function of expression level in these environments. The fitness of the promoter in the gold environment is proportional to the shaded area. (B) Contour plot of the log-fitness change resulting from optimally coupling the promoter to a transcription factor (TF) with signal-to-noise ratio S and correlation R. Contours run from 7.5 at the top right to 0.5 at the bottom right. The three colored dots correspond to the TFs illustrated in panels C–H. The red curve shows optimal S as a function of R. (C–E) Each panel shows the expression distributions of an example TF across the three environments (red, gold, and green curves). The corresponding values of correlation R and signal-to-noise S are indicated in each panel. (F–H) Each panel shows the expression distributions across the three environments for a promoter that is optimally coupled to the TF indicated in the inset. The shaded areas correspond to the fitness in each environment. The total noise levels of the regulated promoters are also indicated in each panel. The unregulated promoter has total noise ? tot = 0.1.
The results of this project suggest that gene expression noise to a significant extent results from propagation of noise from regulators to their target genes. This in turn implies that noise levels should be condition-dependent and we are currently investigating how noise levels change as growth conditions change.
A microfluidic framework for studying single-cell gene expression and growth dynamics
Beyond studying single-cell gene expression using flow cytometry, we aim to directly track both the growth and gene expression dynamics of single-cells as they are experiencing changing growth conditions. To this end we have worked on establishing a micro-fluidic setup in our lab that allows us to track growth of single cells and expression of fluorescent reporters in these cells using time-lapse microscopy. Our novel design is an extension of the so-called Mother Machine design (Fig. 3), which allows us to dynamically mix different growth media, thereby allowing us to arbitrarily vary the growth conditions that the cells experience. In addition, through a successful collaboration with the group of Gene Myers (MPI, Dresden), we have developed image analysis procedures that automatically segment and track the cells, allowing us to obtain accurate tracking of size and gene expression in a large number of single cell lineages.
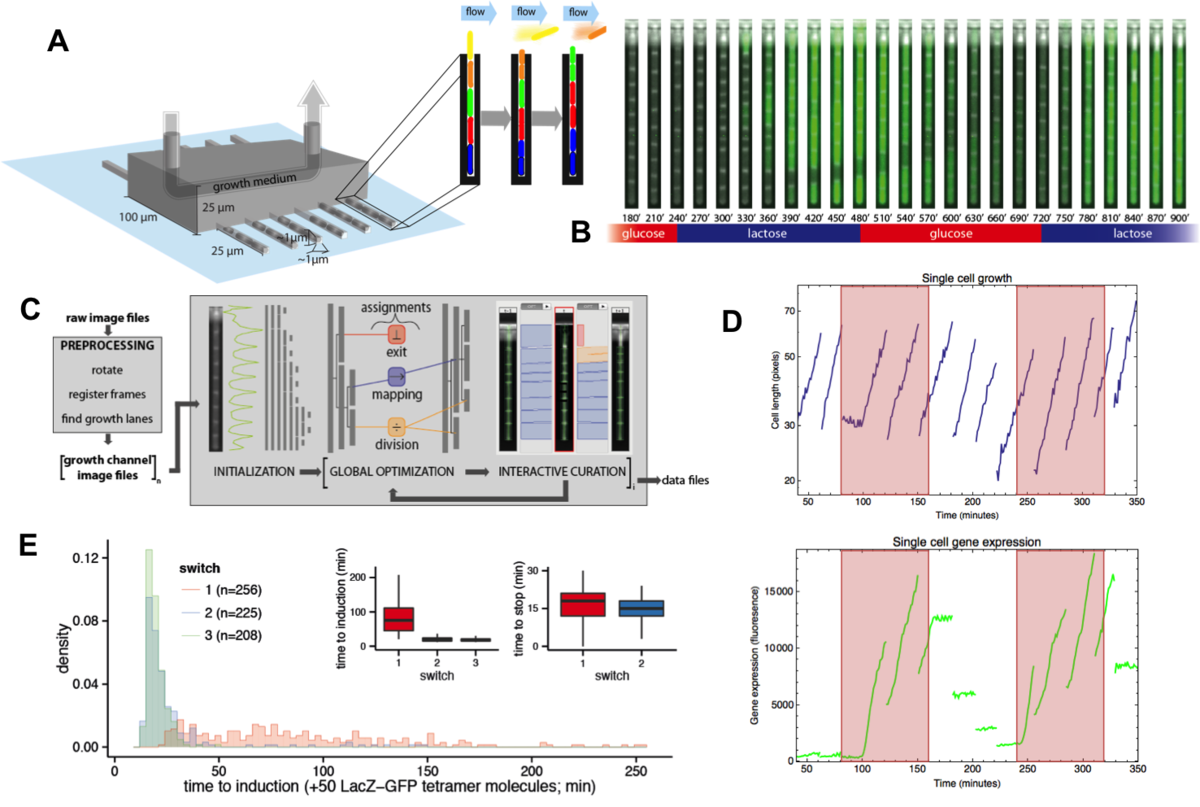
Fig. 3: A microfluidic setup for tracking growth and gene expression in lineages of single E. coli cells across dynamically changing growth conditions. A: The mother machine microfluidic device containing a main flow channel and dead-end growth channels in which E. coli cells grow. Our `dial-a-wave' modified design of this mother machine device, allows arbitrary switching between and mixing of two input media. B: Snap shot images of E. coli cells, carrying a GFP reporter construct reporting expression from the lac operon, in one growth channel of our microfluidic device. Snap shots are 30 minutes apart with time increasing from left to right, and the growth medium switching between glucose and lactose every 4 hours. C: Outline of the Mother Machine Analyzer software which segments the images and tracks the cells. D: Examples of the cell size (top, shown on a logarithmic scale) and gene expression (bottom) of a lineage of single cells across the time course. Note the temporary halt in growth after the first switch from glucose to lactose. Note also how, upon switching to lactose, lac operon expression is induced after an initial stochastic waiting period, and how protein production ceases during growth in glucose, with expression levels approximately halving at each cell division. E: Distribution of the lag times for lac induction for the first (red), second (blue), and third (green) change to lactose. The insets show the summary of lag times for lac operon induction (left) and for lac expression to cease upon switching to glucose (right).
Using this microfluidic setup we are currently studying the stochastic response of single E. coli cells to switches in growth conditions.
Integrated Genotype/Phenotype evolution in E. coli
The availability of large numbers of complete genome sequences has led, over the last 15 years, to a revolution in our understanding of genome evolution and the identification of a number of surprising ‘quantitative laws’ of genome evolution. However, whereas the insights gained from analysis of genomic data have been impressive, they have taught us surprisingly little about what selective pressures in the wild are driving genotype dynamics. In this project we aim to learn about selection pressures that are acting in the wild by combining information on genotype evolution in closely related bacterial strains with extensive quantitative characterization of their phenotypes. In particular, using next-generation sequencing we have determined complete genomes of 91 wild E. coli isolates that were all obtained from a common location at the shore of lake Superior (Minnesota, USA). In parallel we have been characterizing the phenotypes of these strains by assessing their growth in a wide variety of conditions using automated image-analysis of cultures on agar plates. We have started developing theoretical models to describe the joint evolution of genotypes and phenotypes of the strains. We are aiming in particular to develop rigorous quantitative measures of the extent to which different phenotypic traits have been under natural selection in the history of these strains, and to infer how this has impacted their genomes. As part of this project we have also recently developed a new method, called REALPHY, for automatically inferring phylogenies from raw next-generation sequencing data.


